Researcher
You’ll help lead the charge in finding new layers and companies.
You’re a great fit if you spend most of your day researching and learning using AI. No finance background required.
Apply →AGI is coming, yet hundreds of AI supply chain oligopolies still trade at only 1–5x revenue and 5–15x earnings. Most VCs, meanwhile, are bidding up a small set of software startups.
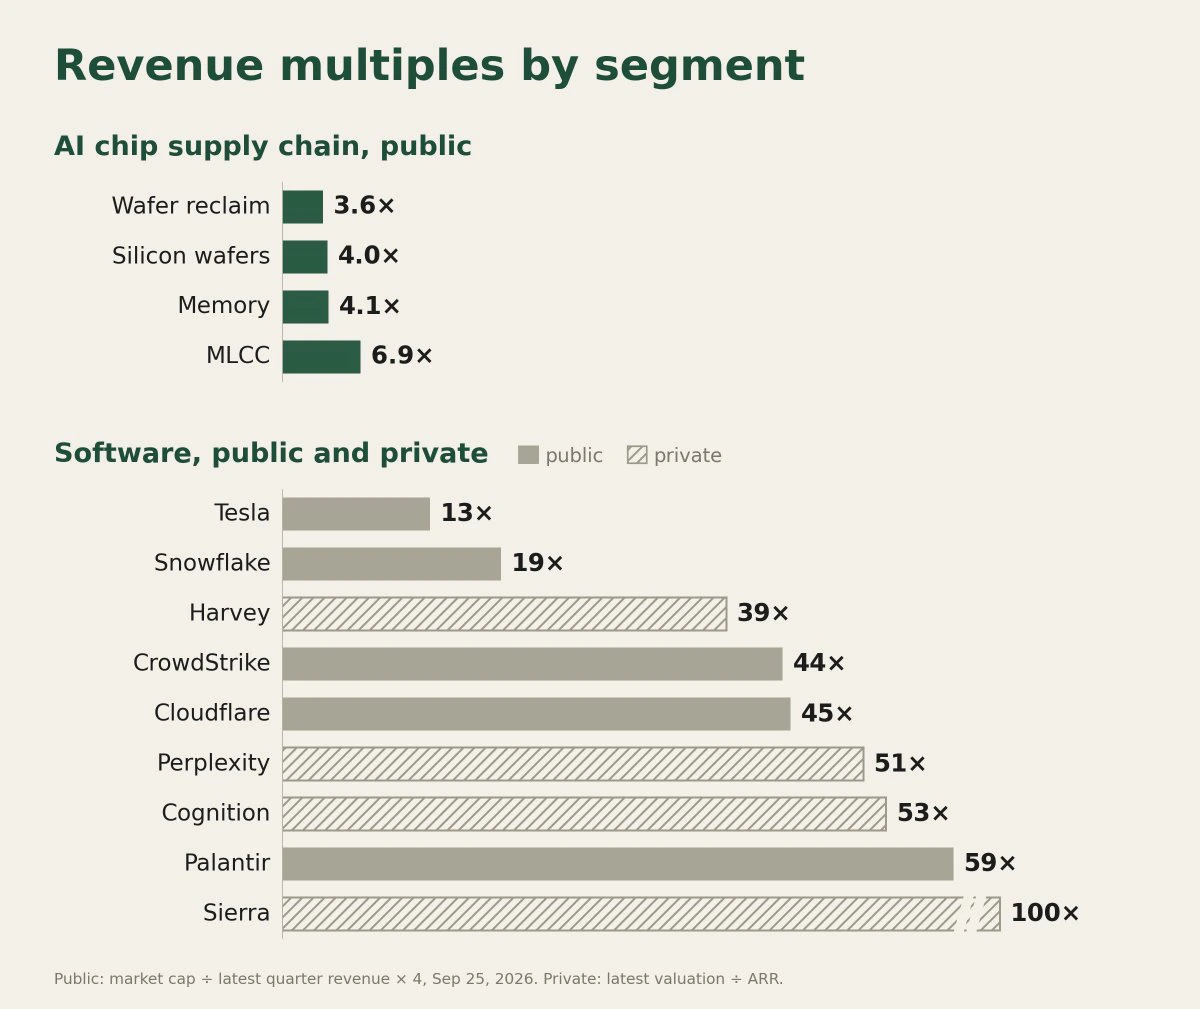
The gap is clearest in revenue multiples. The chip supply chain layers below trade at 3.6–6.9x revenue, while the software companies investors are crowding into, public and private, trade at 13–100x:
We think this is one of the biggest mispricings in markets today. Here’s how we approach it.
We’re building our book around a few strong assumptions, which inform the characteristics we’re looking for in companies:
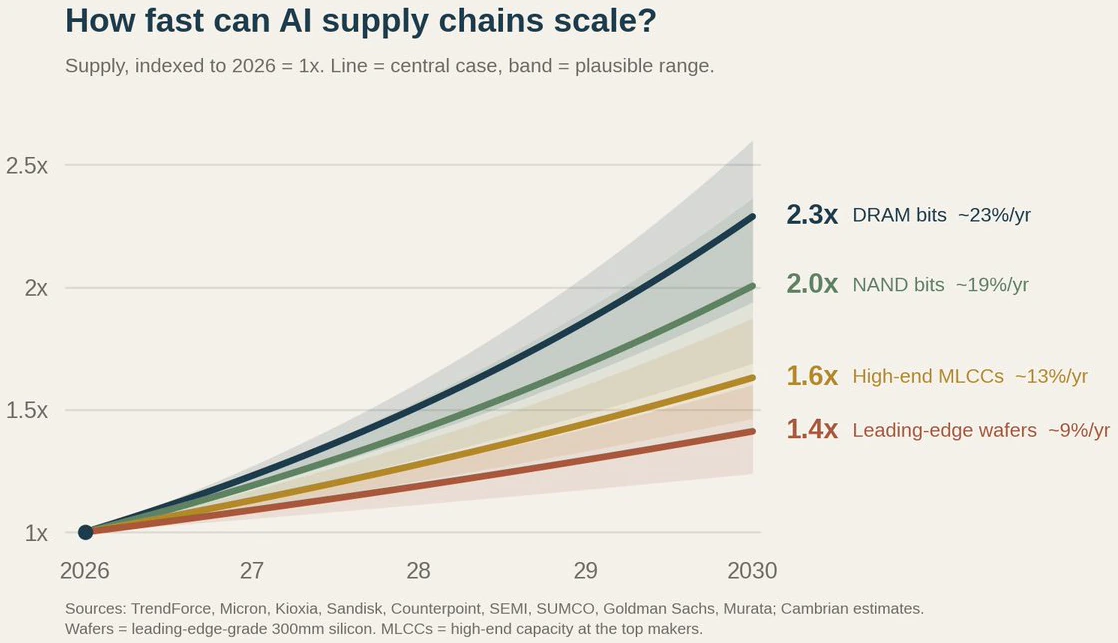
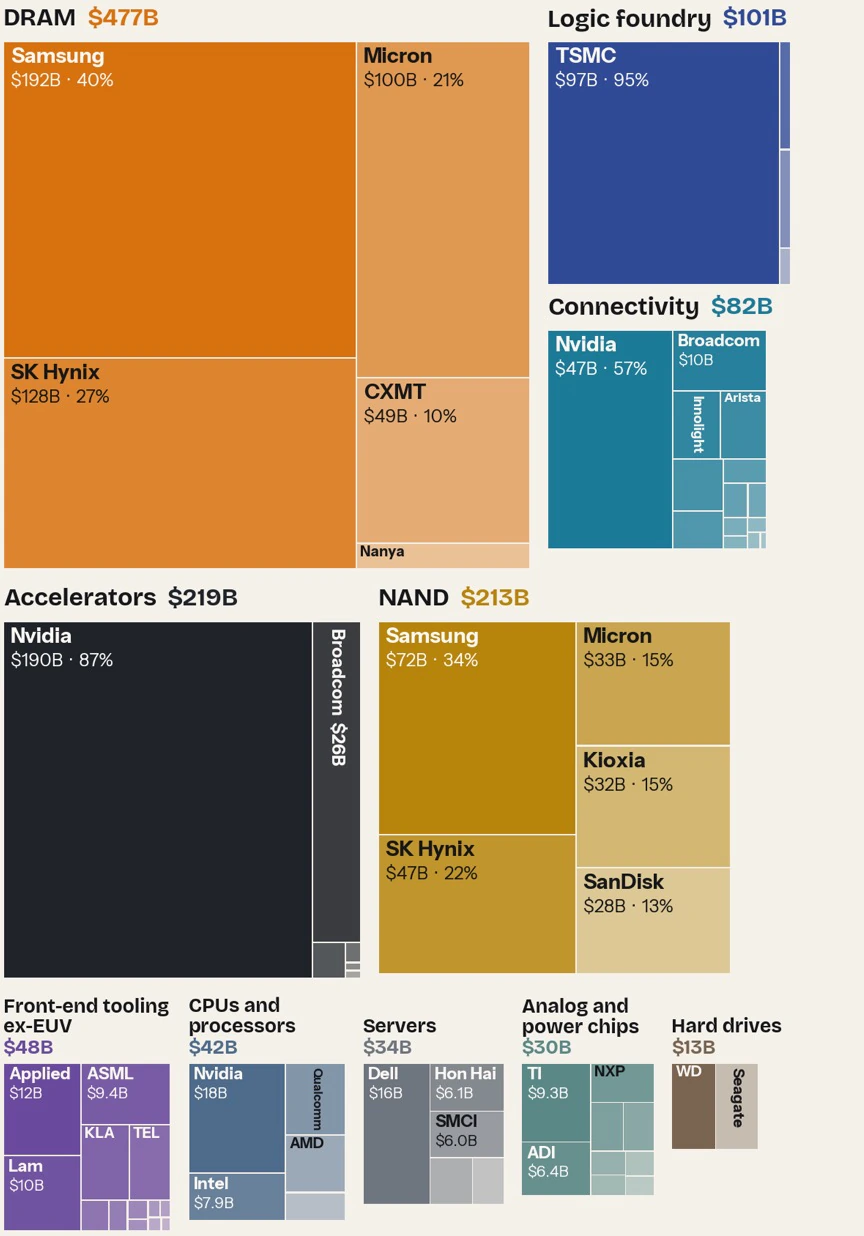
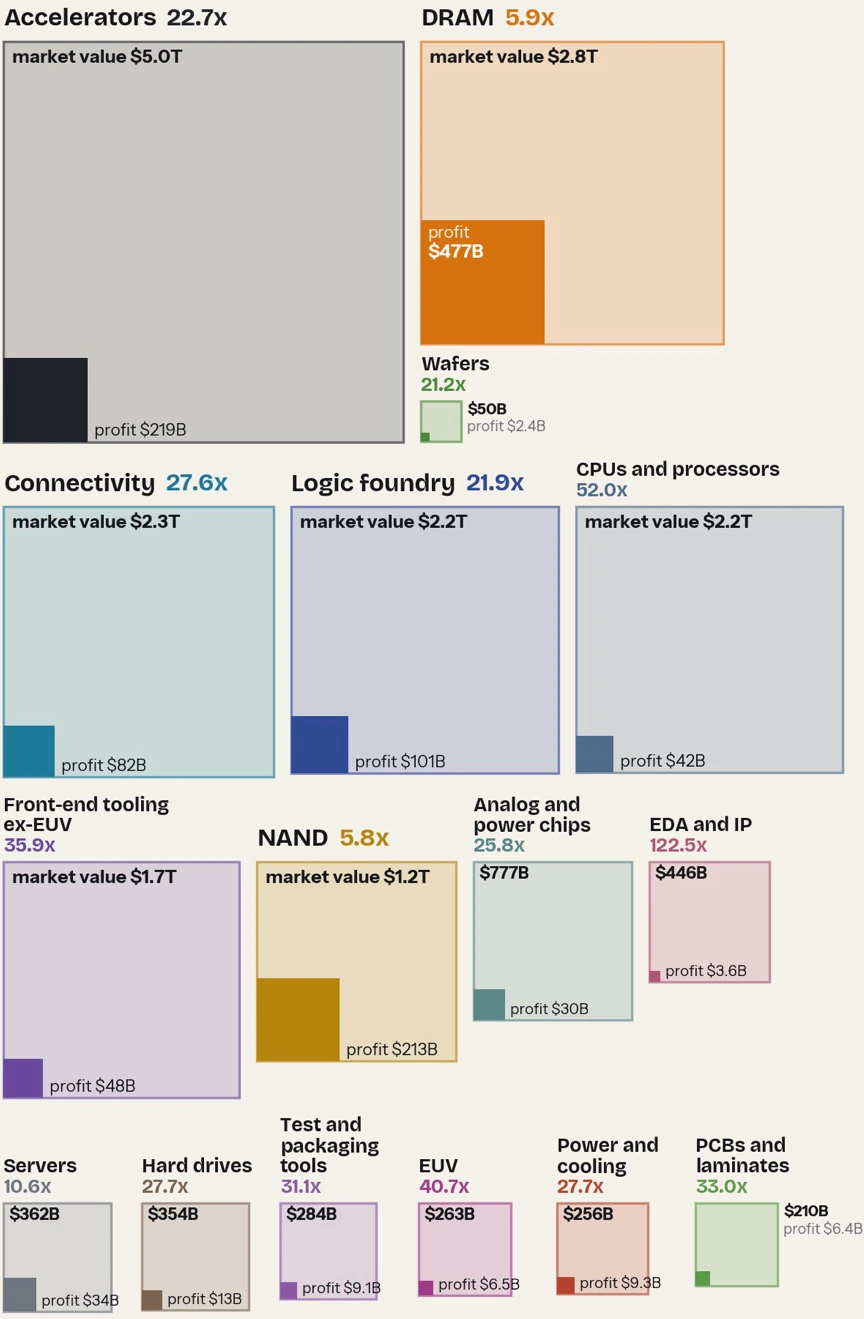
Chart: Cambrian.
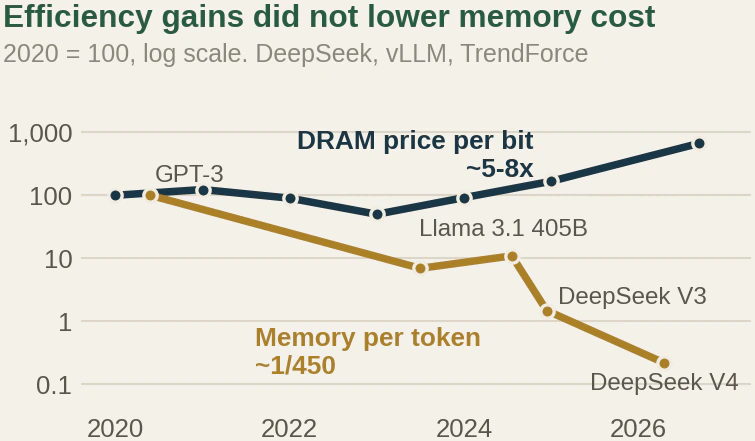
Since we see a low chance of supply catching up, the real risk is radical memory compression: the memory needed per token going down a lot. However, this has already happened: memory needed per token of context has been compressed by over two orders of magnitude from GPT-3 to DeepSeek V4. Over that same period, the price per bit of DRAM still rose 5-8x because of the exponential increase in usage (Jevons paradox).
Another risk, from a budget perspective, is that memory has grown from under 10% of a GPU server’s cost in 2023 to roughly a quarter today, which may push incremental spending toward other inputs.
Chart: Cambrian. Memory = HBM, server DRAM and SSDs.
Silicon wafers meet the characteristics we’re looking for: a hard-to-scale physical input, trading at low multiples, with low utilization that turns into operating leverage. On top of that, they also serve as a sort of hedge to our memory exposure. Wafer makers have large torque to each additional chip shipped because of operating leverage: new capacity takes heavy capex, and the industry has historically run with low utilization, so extra volume flows mostly to profit. If memory becomes cheaper and more available, more chips ship, which is a direct tailwind for AI-grade 300mm wafer makers.
Illustrative cost structure, not a forecast: on 100 of revenue, 55 of fixed costs, 30 of variable costs and 15 of profit. Prices held flat. Chart: Cambrian.
Even though wafers have a lower ‘AI beta’/share of buyers from AI, its customer base is uniquely price inelastic, as a ~$100 product is a key input to a $20k+ product.
That can be compared to memory, which started with a super-elastic customer base, which is partly why it took until Q4 2025 to price surge.
So wafers might reprice even whilst running at only ~10% AI beta. How far prices can rise depends on the pool of margin-elastic buyers, which is set by their margins and by how much of their costs the input makes up:
| Buyer | Input % cost | Op margin | ΔP* to react | % of book |
|---|---|---|---|---|
| Nvidia (HBM) | ~12% | ~60% | +200% | ~10% |
| Hyperscaler servers | ~12% | ~35% | +115% | ~25% |
| Apple | ~6% | ~30% | +200% | ~10% |
| Android mid/ | ~12% | ~4% | +13% | ~25% |
| PC OEMs | ~12% | ~5% | +17% | ~15% |
| Consumer/ | ~10% | ~5% | +20% | ~15% |
| Buyer | Input % cost | Op margin | ΔP* to react | % of book |
|---|---|---|---|---|
| TSMC leading edge | ~1% | ~45% | +1,800% | ~23% |
| DRAM/ | ~1% | ~50–75% | +2,000% | ~28% |
| NAND makers | ~2–3% | ~30% | +450% | ~20% |
| Mature foundries | ~3% | ~20% | +270% | ~15% |
| CIS (Sony etc) | ~3% | ~18% | +240% | ~7% |
| Power/ | ~10–20% | ~25% | +50–140% | ~5% |
A missing wafer costs a DRAM maker far more than the wafer itself, so even a small chance of running short makes a spare wafer worth many times its ~$80 price. And wafer makers are so small next to their customers that even a 10x in their stocks would need profit equal to only ~6.5% of one year of DRAM sales:
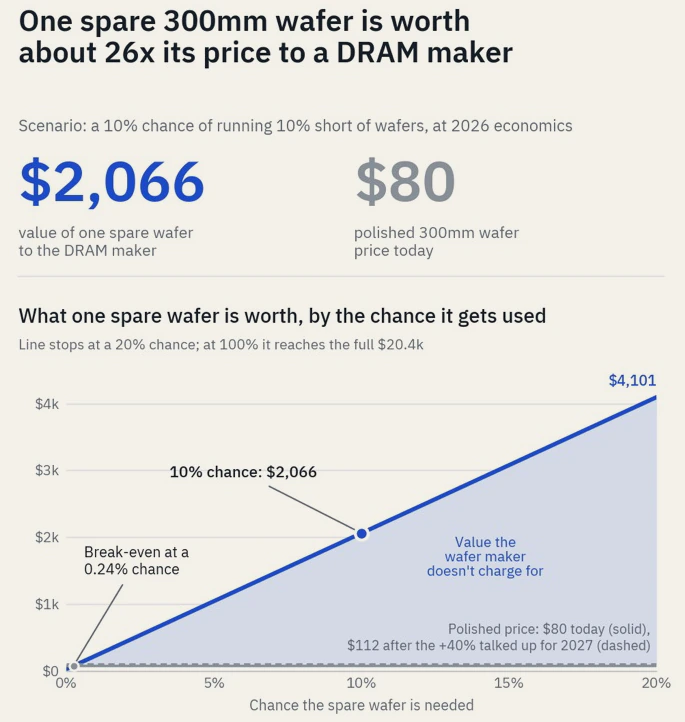
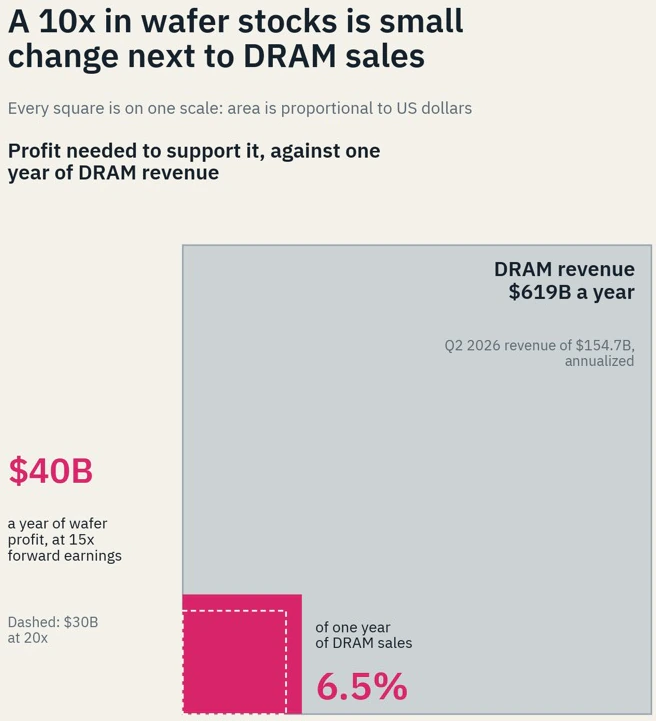
Chart: Cambrian.
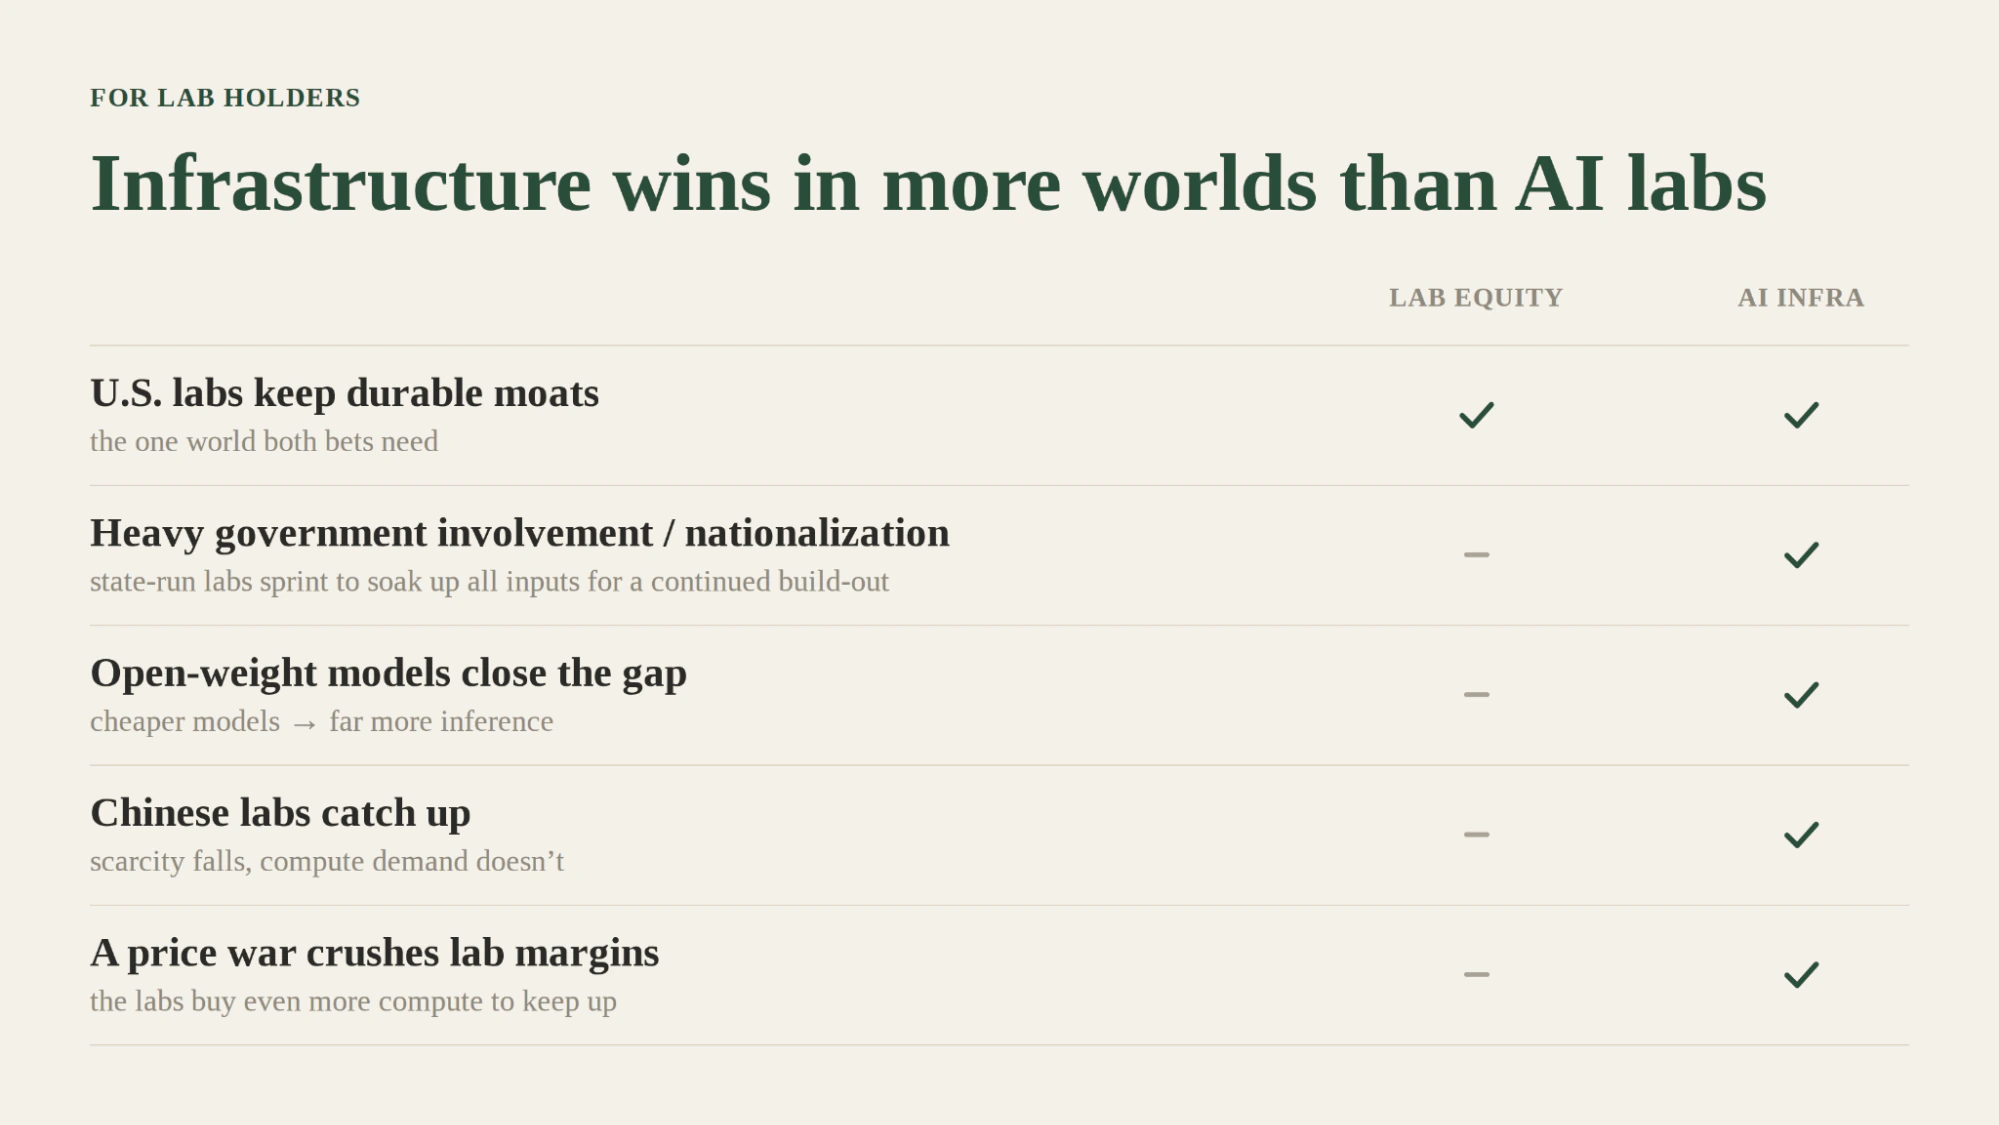
Even in a world of recursive self-improvement (RSI), owning lab equity requires more things to go right than owning the supply chain.
Lab equity mainly pays off in one world: the US labs keep durable moats. Infrastructure wins in that world too, but also if governments step in or nationalize the labs, if open-weight models close the gap, if Chinese labs catch up, or if a price war crushes lab margins. In each of those worlds, demand for compute holds up or grows:
The whole free world must have access to AI’s equity upside, even in countries without their own AI companies.
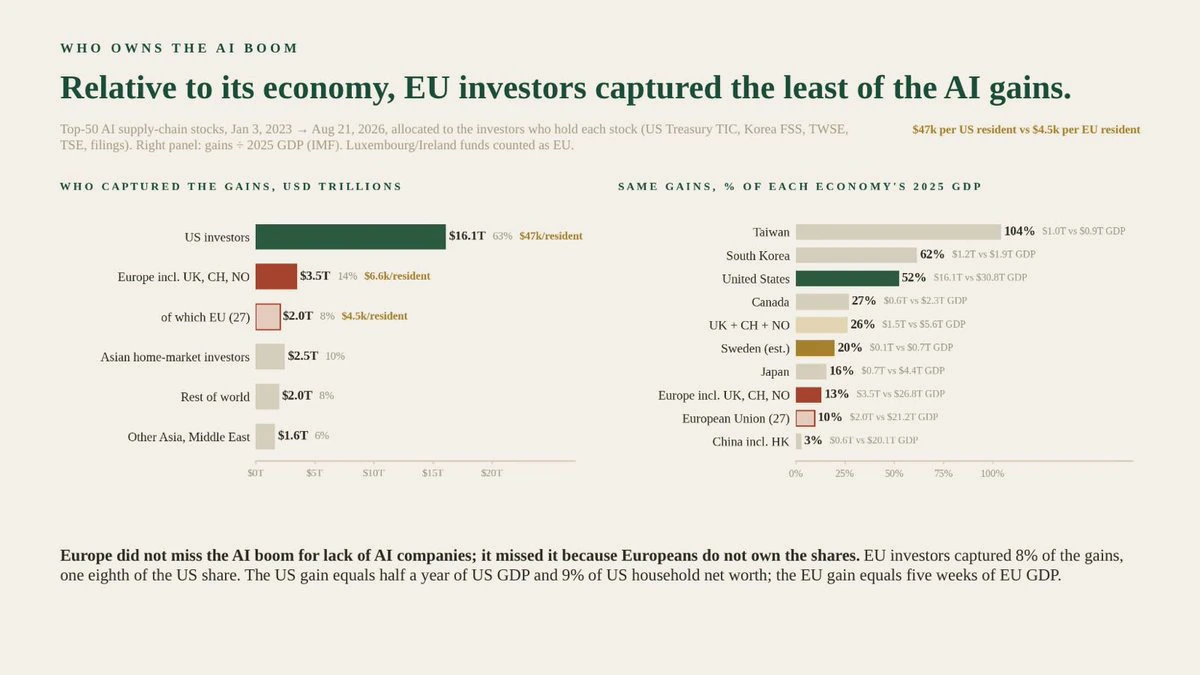
So far, that isn’t happening. European investors, retail and institutional, have been the least successful in the world at capturing AI equity gains. Of the gains in the top 50 AI supply chain stocks since January 2023, EU investors captured 8%: about $4.5k per resident, against $47k per resident in the US:
We’re hiring for two roles. To apply, email a short note and your CV to lonis@cambriancapital.ai.
The provided information is proprietary to Cambrian Capital Asset Management, LLC (“Cambrian”, “we”, “our” or “us”) with respect to Cambrian Thesis Capital Fund, LP, a Delaware limited partnership (the “Master Fund”), and Cambrian Thesis Capital Offshore Fund Ltd, a British Virgin Islands business company (the “Offshore Feeder Fund” and, together with the Master Fund, the “Fund”).
On and after October 1, 2026, interests and units in the Fund will be offered and sold in reliance upon the exemption from registration provided by Rule 506(c) of Regulation D promulgated under the Securities Act of 1933, as amended. General solicitation and general advertising may be used in the offering. Each purchaser must be an “accredited investor” within the meaning of Rule 501(a) of Regulation D, and the Fund will take reasonable steps to verify that status before a sale. Each prospective investor will also be required to represent, among other things, that it is acquiring the Interests for investment purposes only and not for resale or distribution, and to satisfy the Fund’s other eligibility requirements.
This disclosure and the information contained herein does not constitute, or form part of, any offer to sell or issue, or any solicitation of an offer to buy or subscribe for, any units of or other interests in the Fund. In deciding whether to invest in the Fund, prospective investors will be provided with a confidential Private Placement Memorandum, which includes information about risks associated with an investment in the Fund and the material terms of the Fund’s constituent documents. The information contained in this disclosure is subject to all such definitive investment documentation.
The value of investments may fall as well as rise. An investment in the Fund is suitable only for sophisticated investors and requires the financial ability and willingness to accept the risks inherent in the Fund.
Certain information (including any statements of opinion and/or belief) disclosed herein is based on or was obtained or derived from data published or prepared by other parties. While the unaffiliated third party sources are believed to be reliable, neither Cambrian nor any of its directors, officers, employees, partners, shareholders or agents has independently verified such information nor assumes any responsibility for the accuracy of any such information and no such party shall have any liability to any recipient of this disclosure or any other person relating to or resulting from the use of or reliance on any such information contained herein or any errors therein or omissions therefrom.
No representation, warranty, assurance or undertaking (express or implied) is given (and can therefore not be relied upon as such), and no responsibility or liability is or will be accepted by us or any of our affiliates or our respective officers, employees or agents as to the adequacy, accuracy, completeness or reasonableness of the information, statements and opinions expressed. Any opinions expressed do not constitute legal, tax or investment advice and can therefore not be relied upon as such. The information contained (which does not purport to be comprehensive) is believed to be accurate only at the date of this disclosure and does not imply that the information herein is correct at any time after the date hereof and such information is subject to change at any time without notice. The views expressed herein are subject to change based on market and other conditions and we give no undertaking to update the information, to reflect actual events, circumstances or changes in expectations or to provide additional information after its disclosure, even if the information becomes materially inaccurate.
To the extent that this disclosure includes information about prior activities of the management of Cambrian or projections of anticipated future performance of the Fund and other forward-looking statements, such projections and forward-looking statements included herein, or otherwise made orally or in writing from time to time, are not guarantees of future performance and involve certain risks, uncertainties and assumptions that are difficult to predict as well as factors that are beyond Cambrian’s control. Past performance is no guarantee of future performance and should not be relied on in deciding whether to invest in the Fund. Any gross returns presented herein do not reflect the deduction of any Fund expenses or other expenses that may be borne by third-party investors. An individual investor’s actual performance may vary materially based on any number of factors, including the timing of capital contributions and distributions as well as the deduction of all applicable fees and expenses.
The recipient acknowledges and agrees that no person has, nor is held out as having, any authority to give any statement, warranty, representation, assurance or undertaking on our behalf in connection with any potential investment.